Deepening Drought Western USA – Putting Last Week’s Polar Plunge into Perspective

16 Jan 2014, 7:59 am
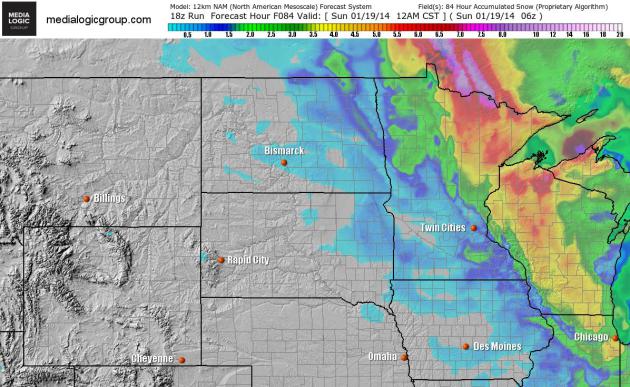
A Series Of Clippings. NOAA’s 12km NAM model shows some 3-4″ snowfall amounts over the next 84 hours from the Minnesota Arrowhead into much of Wisconsin; the bulk of Saturday’s snow expected to stay just north/east of the Twin Cities. Source: Ham Weather.
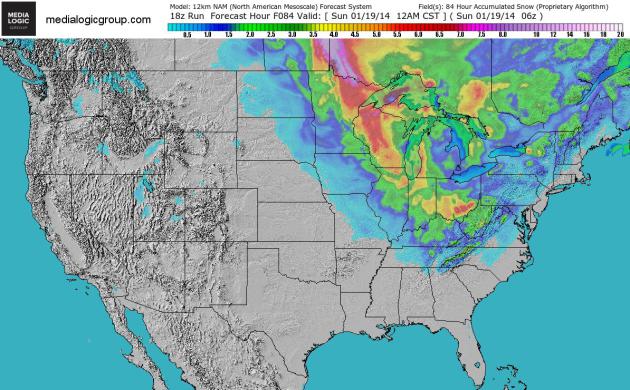
Super-Sized Alberta Clipper. Saturday’s clipper may drop a plowable snowfall as far south as Indianapolis and Cincinnati. As long as winds aloft blow from the northwest it’ll be tough for any storms to tap moisture from the Gulf of Mexico. Map above: NOAA’s 84 hour NAM snowfall accumulation.
Cold, But Not As Cold. I still believe that what we experienced early last week was the worst of winter (the coldest cold front in 17 years, to be exact). There’s a 103% probability of more cold frontal passages in the coming weeks (that’s going out on a limb), but most of them will be a pale imitation of what we endured last week. 2-meter temperature prediction courtesy of NOAA and Ham Weather.
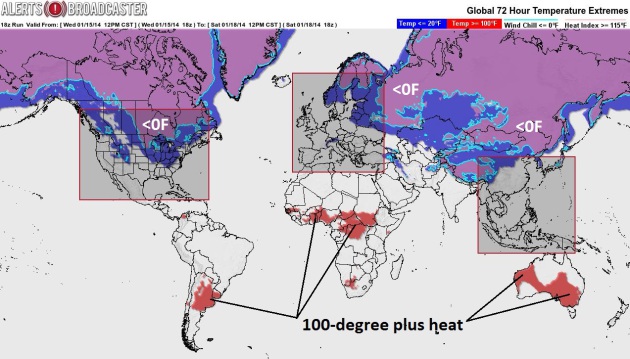
Wild Extremes. The map above, courtesy of Alerts Broadcaster, shows the warmest and coldest temperatures expected, worldwide, over the next 72 hours. 100-degree heat for central Argentina and Africa, and Australia continues to swelter with a growing risk of wildfires.
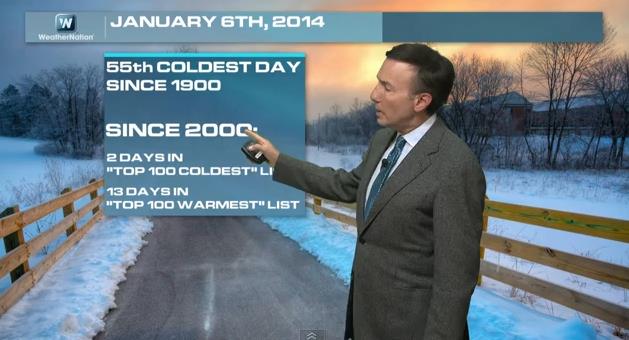
Putting Last Week’s Polar Plunge Into Perspective. The atmosphere is warming, and the data (NOAA/NASA) shows fewer arctic outbreaks since the 1990’s. But that doesn’t mean we won’t get whacked every once in a while. Today’s Climate Matters focuses on the frequency of numbing cold fronts over time: “WeatherNationTV Chief Meteorologist Paul Douglas goes over the cold snap that affected much of the US in the first half of January. But what about the other half of the nation? California had near record highs and the driest year on record. The first half of January was well below average for much of the US, and like flipping a switch, it trends warmer than average. Weather whiplash anyone?”
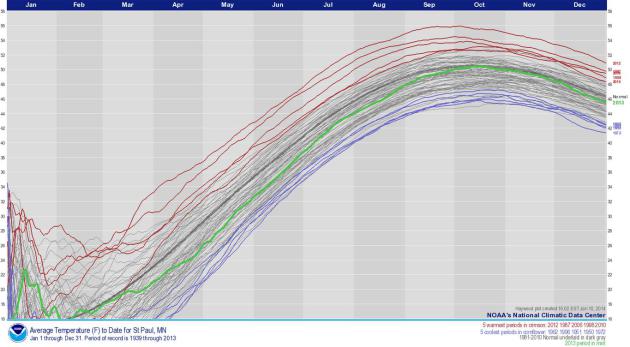
2013: 41st Warmest Year On Record For Twin Cities. The 5 warmest years at MSP since 1939: 2012, 1987, 2006, 1998 and 2010, in that order. Source: NOAA.
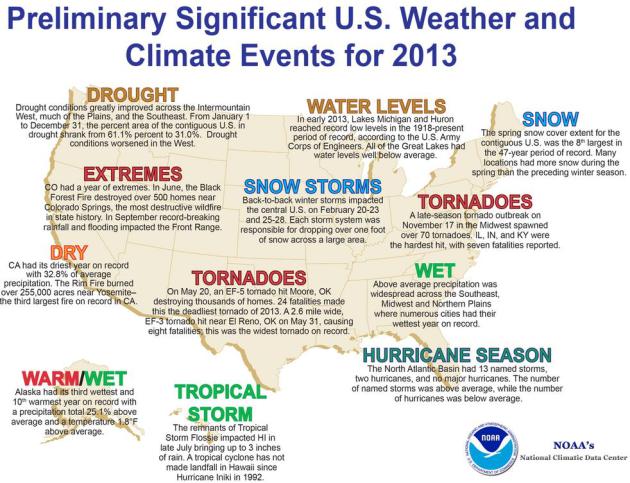
2013 USA Weather Recap. Here’s a clip from a good overview of weather last year across America, courtesy of NOAA: “In 2013, the contiguous United States (CONUS) average temperature of 52.4°F was 0.3°F above the 20th century average, and tied with 1980 as the 37th warmest year in the 119-year period of record. The 2013 annual temperature marked the coolest year for the nation since 2009. The 2013 CONUS average temperature was 2.9°F cooler than the 2012 average temperature, which was the warmest year on record for the nation. Since 1895, when national temperature records began, the CONUS has observed a long-term temperature increase of about 0.13°F per decade. Precipitation averaged across the CONUS in 2013 was 31.17 inches, 2.03 inches above the 20th century average. This marked the 21st wettest year on record for the nation and the wettest since 2009. Compared to 2012, which was the 18th driest year on record, the CONUS was 4.50 inches wetter in 2013. Over the 119-year period of record, precipitation across the CONUS increased at an average rate of 0.17 inch per decade…”

Year’s First National Water Forecast Predicts Limited Supply West Of Continental Divide. At the rate we’re going, with unusually dry, mild weather (and brushfires) during the alleged wet season on the west coast, 2014 may bring record drought. Here’s an excerpt of a press release from the USDA: “A limited water supply is predicted west of the Continental Divide, according to the USDA Natural Resources Conservation Service (NRCS) National Water and Climate Center (NWCC) data in its first forecast of 2014. The NWCC also predicts normal water supply east of the Continental Divide and will continue to monitor, forecast and update water supplies for the next six months. Monitoring snowpack of 13 western states, the center’s mission is to help the West prepare for spring and summer snowmelt and streamflow by providing periodic forecasts. It’s a tool for farmers, ranchers, water managers, communities and recreational users to make informed, science-based decisions about future water availability...”
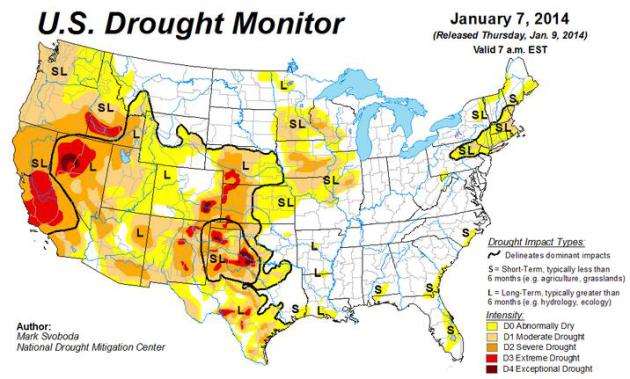
Far West Got Drier Last Year, Data Shows. Following up on the story above here’s an excerpt from a New York Times story: “Drought conditions in California and elsewhere in the Far West intensified last year, government scientists said Wednesday, adding to concerns about water supplies in the region. Although on the whole 2013 was a wetter than average year for the contiguous 48 states, the scientists said, that statistic masked sharp regional differences. Many states east of the Rockies had much higher than average precipitation, helping to alleviate drought in the central United States and the Southeast...”
* latest U.S. Drought Monitor is here.
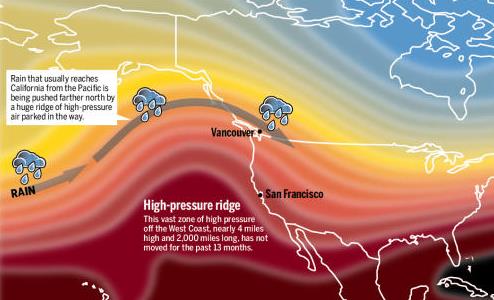
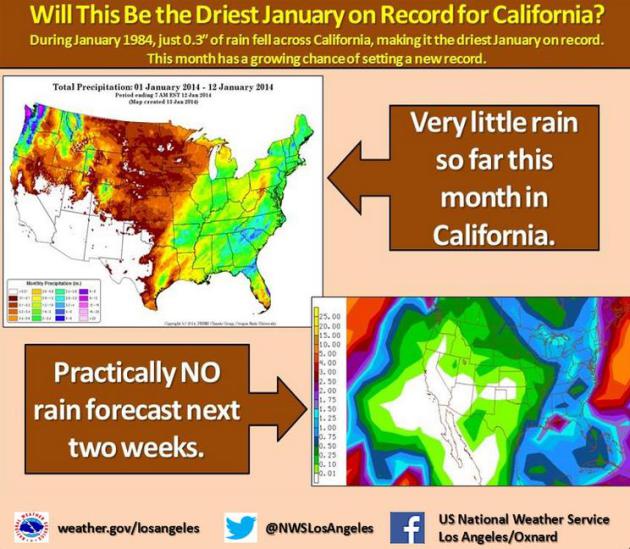
California Drought: What’s Causing It? 2013 was the driest year in recorded California history, and a persistent ridge of high pressure continues to deflect wet, Pacific storms well north, prompting worries of an even more serious drought in 2014. Here’s a clip of a good explanation from the San Jose Mercury News: “…With each passing week, California’s lack of rainfall becomes more serious. Last year was the driest calendar year in recorded history in California in most cities, with records going back 160 years. The first snowpack reading in the Sierra Nevada earlier this month found a snowpack of just 20 percent of normal...”
Weather graphic above: WeatherWest.com.
Single Digit Danger: Why Cold Weather Raises Heart Risks. Here’s an excerpt of a timely and interesting article at Consumer Affairs: “…When temperatures plunge your chance of having a heart attack goes up if you already have a higher risk of heart trouble. Here’s why: cold temperatures can constrict arteries and raise blood pressure, causing the heart to work harder or triggering tears or clots in the arteries. Compared to the summer months, people are 26% to 36% more likely to die in winter heart-related health issues, according to research cited by AARP...”
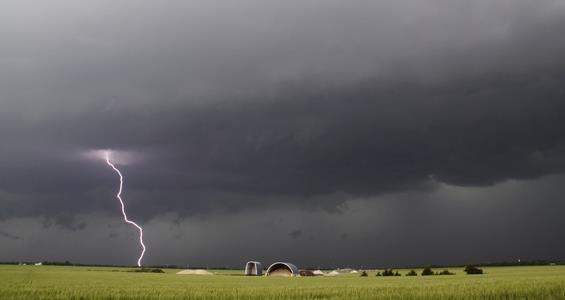
Almost No Americans Die From Lightning Strikes Anymore – Why? Great question – and the trends are real. Heightened awareness, education, a migration from farms to cities, new technologies (Doppler on your cell phone?) along with media updates have dropped the lightning death rate dramatically. Here’s an excerpt of a great recap from The Atlantic: “In the first half of the 20th century, hundreds of Americans died each year from lightning strikes. The data is messy, but in the years from about 1920 to the middle of the 1940s, about 400 people were killed by lightning annually. Last year, 23 did, the fewest on record. Other recent years have had a similarly small number of lightning fatalities, with 28 in 2012, and 26 in 2011, the previous record. These numbers are all the more remarkable considering how the population of the United States has exploded over the same time period..”
Photo credit above: “Lightning strikes an open field in Clearwater, Kansas.” (Reuters).

Surge In Shark Attacks Causes Alarm In Hawaii. The water is lovely, just keep an eye out for occasional fins. I’ll still take Minnesota’s lakes, mosquitoes and all. Here’s a clip from The Los Angeles Times: “…So far, the increases in attacks in 2012 and 2013 — which followed three years in which there were just three shark attacks annually — do not appear to have affected tourism. More than 2.1 million people visited Maui last year, figures that Terryl Vencl, executive director of the Maui Visitors Bureau, said she had not seen since before the recession. “I think people realize it is still a rare occurrence,” Vencl said in an email. There is no question, however, that many swimmers and snorkelers are adjusting their routines based on the location of encounters...”
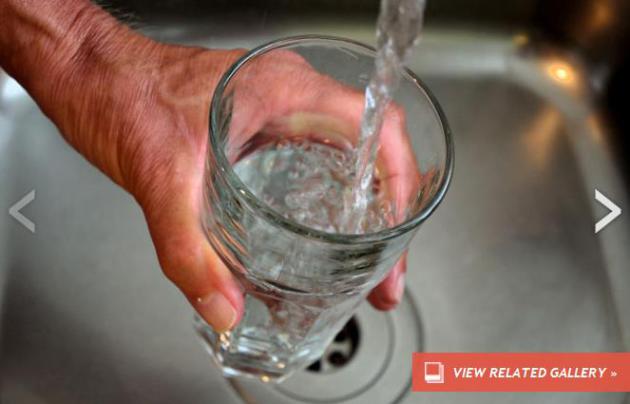
How Safe Is U.S. Drinking Water? In light of the widespread water contamination impacting residents of West Virginia, it’s probably a timely question to ask. Here’s an excerpt of a story at Discovery News: “…Each year there are more than 10,000 spills of oil and hazardous substances, according to federal estimates, many that get into water supplies. From raw sewage to rocket fuel, sometimes these spills evaporate or dissipate into the air or water. Other times, as in Charleston, W.Va., the results are disastrous to human health and wildlife. The nation’s worst municipal water contamination occurred in Milwaukee in 1993, when an outbreak of the Cryptosporidium parasite sickened 400,000 people and killed 69. A malfunctioning filter at the city water plant allowed the organism to spread throughout the city’s entire public water system...”
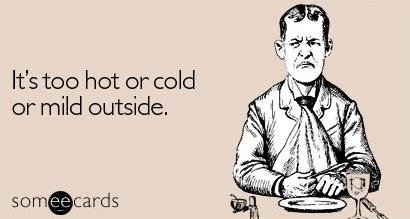
Scientists: Americans Are Becoming Weather Wimps. The reality: we’re seeing fewer of the polar invasions that swept across the USA last week, especially since 2000. So now when it does get brutally cold for a few days it seems like the end of the world. Back in the 70s? Business as usual. Here’s a clip from Yahoo News: “…In the past 115 years, there have been 58 days when the national average temperature dropped below 18. Carbin said those occurrences often happen in periods that last several days so it makes more sense to talk about cold outbreaks instead of cold days. There have been 27 distinct cold snaps. Between 1970 and 1989, a dozen such events occurred, but there were only two in the 1990s and then none until Monday. “These types of events have actually become more infrequent than they were in the past,” said Carbin, who works at the Storm Prediction Center in Norman, Okla. “This is why there was such a big buzz because people have such short memories...”
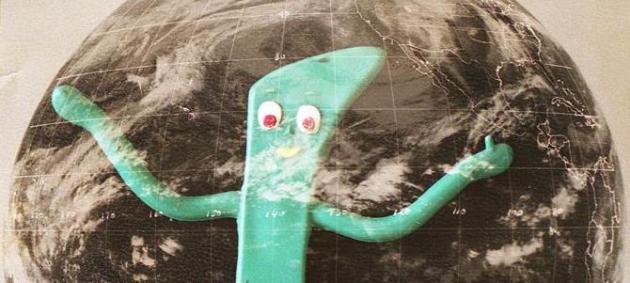
Weather Terminology 101. Here’s a clip from an interesting article focused on weather and climate terms you may be hearing in the popular media these days, courtesy of onearth.org: “The “polar vortex” that froze North America in its tracks this week isn’t exactly new. Cyclones of frigid air swirl around the Arctic all the time. What’s different is that this latest polar vortex dipped far enough south to send Floridians scrambling for their mittens. The term also showed up all over my Facebook feed. Granted, I run with a lot of science journalists, but this time even my let’s-take-a-picture-of-my-breakfast friends (no offense, guys) were discussing the rare and strange interaction of the polar vortex with the jet stream and its possible relation to melting Arctic sea ice … driven by climate change. Thanks to wacky weather (and social media hashtags), meteorology geekspeak has hit the mainstream…”
Graphic credit: Mike Fernwood, Flickr.
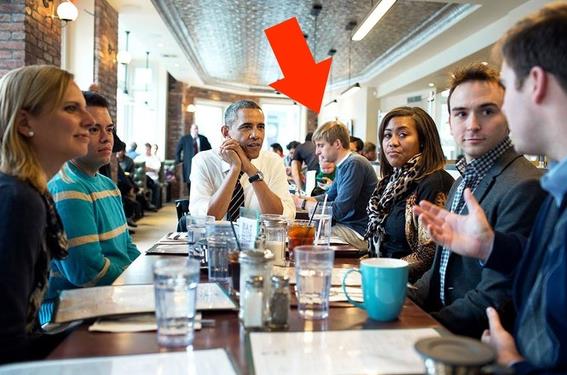
What Happens When The President Sits Down Next To You At A Cafe. I enjoyed this article from Robinson Meyer at The Atlantic; here’s an excerpt: “…When the president arrived, 40 minutes later—stepping out of his SUV, smiling, with a little wave—the nerves subsided. The cafe is split into two long halves, and he first turned to visit its opposite half, smiling, shaking hands, shaking more hands. And then—for the first time in nearly an hour—I could work. I found that I was so accustomed to his voice, how he holds his body, his aura, that ignoring him in person is as easy as ignoring a TV. Easier, in fact. He stops being the president and starts being That Guy Who You See In Tweets, That Guy Who Gives Speeches, That Guy…”
Photo credit above: “The author, at “work”. (Pete Souza/The White House)
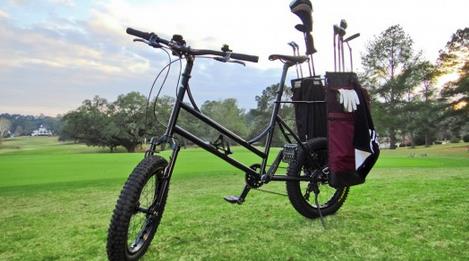
Golf Bike Provides “Greens” Transportation. Allow me to daydream about 1). summer, 2). golf, and 3). a leisurely bicycle ride. Here’s a clip from a story at Gizmag: “…So, what makes the Golf Bike an actual “golf bike”? For starters, it has built-in golf club bags. Users transfer their clubs into those bags at the start of a round, making sure to distribute the weight more or less evenly. It also has small-diameter wheels that require less torque to accelerate, along with relatively wide, soft tires – both of these features are intended to minimize damage to the course…”

NameMyDaughter.com. I know, it’s a sad, sorry way to claim your 15 minutes of Internet fame, but we just can’t look away, can we? That poor girl. Here’s a clip from the web site: “Hi, My name is Stephen and much to the disbelief of my wife, I have decided to let the internet name my daughter. Yeah that is an asterisk, Unfortunately internet I know better than to trust you. We will ultimately be making the final decision, Alas my daughter shall not be named WackyTaco692. Sorry guys the wife wouldn’t go for a free for all. Inappropriate submissions may be removed — Yeah looking at you Graeme. You know what you did.”
_____________________________________________________________________________________
ABOUT ME
Welcome to the WeatherNation blog. Every day I sift through hundreds of stories, maps, graphics and meteorological web sites, trying to capture some of the most interesting weather nuggets, the stories behind the forecast. I’ll link to stories and share some of the web sites I use. I’m still passionate about the weather, have been ever since Tropical Storm Agnes flooded my home in Lancaster, PA in 1972. I’ve started 5 weather-related companies. “EarthWatch” created the world’s first 3-D weather graphics for TV stations – Steven Spielberg used our software in “Jurassic Park” and “Twister”. My last company, “Digital Cyclone”, personalized weather for cell phones. “My-Cast” was launched in 2001 and is still going strong on iPhone, Android and Blackberry. I sold DCI to Garmin in 2007 so I could focus on my latest venture: WeatherNation. I also write a daily weather column for The Star Tribune startribune.
RE: “almost no Americans getting struck by lightning anymore.” Hmmm…seeing as how my chances of being HIT by lightning are greater than my winning the Powerball…should I just STOP buying lottery tickets? 🙂
signed, needs to know before I’m penniless in MN