
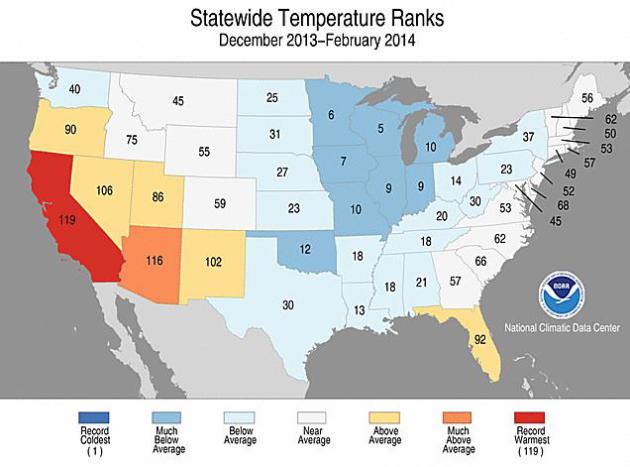
How Did Winter Rank? Here are the standings, based on data from NOAA NCDC, for meteorological winter (December 1 through February 28). Wisconsin saw the 5th coldest winter in 119 years, while California experienced the warmest winter on record. The lower 48 states experienced an average temperature of 31.3F, 1F colder than average.
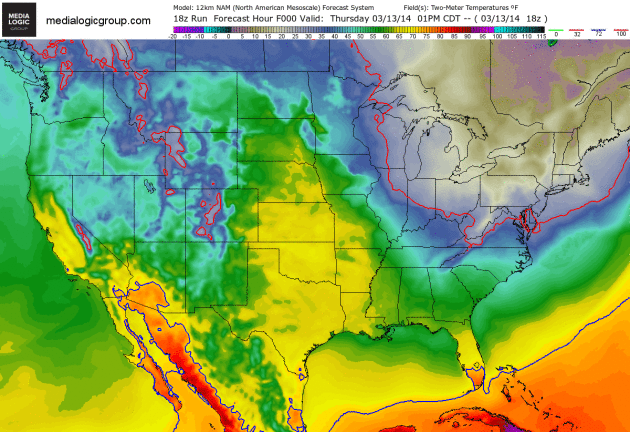
A Fickle Thaw. Much of America east of the Rockies will see a warming trend into Friday, but Canadian air leaks south of the border again over the weekend from the Upper Mississippi Valley into the Great Lakes and New England. Spring is always two steps forward, one step back. Or is it the other way around? 2 meter NAM temperature forecast: NOAA and Ham Weather.
Winter of 2013-14 Already Tops 2012-13 For Number of Hurricane-Force Storms in North Atlantic. Tell that to residents of Britain, where they just had the wettest winter in at least 250 years of record-keeping. NOAA’s climate.gov has the story; here’s an excerpt: “…According to NOAA’s Ocean Prediction Center, 20 separate hurricane-force wind events occurred during January through February alone, and 14 of them had low-pressure centers that underwent the rapid intensification that meteorologists call bombogenesis, in which the storm’s central pressure drops by at least 24 hPa in a 24-hour period. In addition, 8 of the low centers had a central pressure below 950 hPa. Between October 25, 2013, when the first hurricane-force event of the season occurred, and March 8, when the most recent one to date occurred, 43 unique hurricane-force events have blasted their way across the North Atlantic. Thirty of them underwent rapid intensification. The most intense system occurred on December 24, 2013; pressure in the heart of the storm dropped to 929 hPa as the storm lurked north and northwest of the British Isles…”
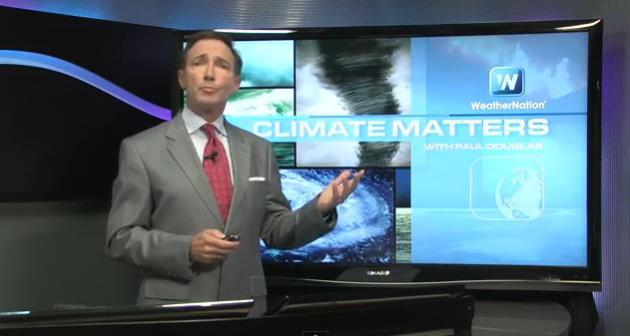
More Whiplash: Ice Storm To Severe Storms In Less Than A Week. Not a great year to be a tree in the Carolinas, where the atmosphere can’t quite make up its mind whether it’s winter or spring. Many cities from St. Louis to Philadelphia reported near-record 30-45 degree temperature drops in less than 24 hours earlier this week; the subject of today’s Climate Matters: “WeatherNationTV Chief Meteorologist Paul Douglas goes over the huge temp swings associated with this latest winter storm. High winds and multiple ice storms led to power outages in Washington DC and downed trees in North Carolina. And all the snow! More places are creeping near their snowiest winters on record. Here’s to hoping we don’t miss Spring!”

Drought Blamed For Rising Food Prices. Will the symptoms of a deepening drought in California show up soon in Minnesota grocery stores? Here’s a video and article excerpt from KGO-TV, ABC 7 in the San Francisco Bay Area: “Some of the first effects of the drought in California are starting to be seen in grocery stores as prices at Bay Area market begin to rise. In many cases, consumers are only getting half the food for the same price they paid before the drought. The price of beef alone has doubled ever since ranchers began selling off their herds because of the lack of grass...”
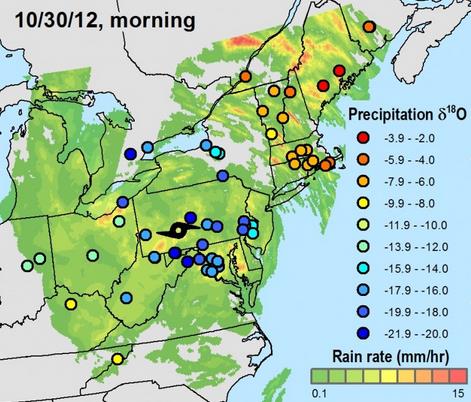
Hurricane Rainwater Samples Map Sandy’s Evolution. No, all rains are not created equal. Here’s a unique example of crowd-sourcing and how rain with slightly different isotopes was used to track Sandy’s arrival in late October of 2012; an excerpt from Claims Journal: “…Sandy left a distinctive isotopic signature in rain collected from the mid-Atlantic up into in New England that shows how a dry cold front originating out of the Midwest joined with Sandy – which developed from a tropical wave over warm water in the Caribbean – and likely prolonged and expanded the storm,” says Bowen. The sampling technique provides a new way of studying how these “extra-tropical” hurricanes interact with the weather systems of the northern latitudes, and thereby aids in hurricane forecasting and analysis…”
Image credit above: “Snapshot of rainfall and oxygen-18 isotope values using crowdsourced rainwater samples collected during landfall of Superstorm Sandy.” Chart: Gabe Bowen, University of Utah.
Here are a few not-so-fun scenarios to consider. Remember, it’s the unknown unknowns that often come back to bite you:
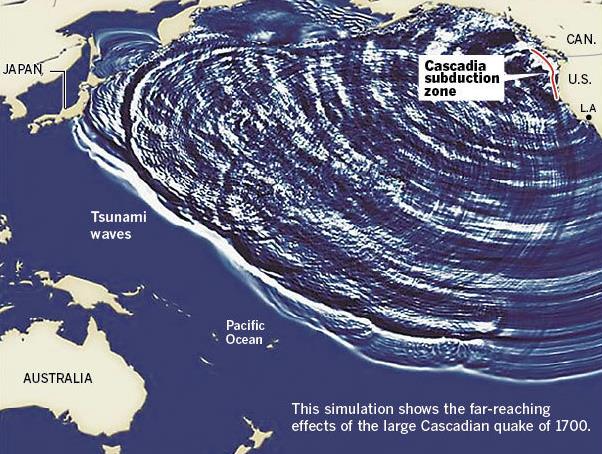
A Cascadia Quake Could Devastate. The Los Angeles Times has an interesting article and infographic that explains the nagging risk of earthquakes and resulting tsunamis, and not from the San Andreas fault; here’s an excerpt: “…The Cascadia zone extends 700 miles along the coast from near Eureka, Calif., to Vancouver, Canada, and is capable of producing a catastrophic 9.0 earthquake and tsunami, as happened Jan. 26, 1700. A graphic below shows the tsunami that likely was produced by the large-magnitude quake more than 300 years ago and caused damage as far away as Japan. Shown here is how this subduction zone creates such large quakes and tsunamis...”
____________________________________________________

Welcome to the WeatherNation blog. Every day I sift through hundreds of stories, maps, graphics and meteorological web sites, trying to capture some of the most interesting weather nuggets, the stories behind the forecast. I’ll link to stories and share some of the web sites I use. I’m still passionate about the weather, have been ever since Tropical Storm Agnes flooded my home in Lancaster, PA in 1972. I’ve started 5 weather-related companies. “EarthWatch” created the world’s first 3-D weather graphics for TV stations – Steven Spielberg used our software in “Jurassic Park” and “Twister”. My last company, “Digital Cyclone”, personalized weather for cell phones. “My-Cast” was launched in 2001 and is still going strong on iPhone, Android and Blackberry. I sold DCI to Garmin in 2007 so I could focus on my latest venture: WeatherNation. I also write a daily weather column for The Star Tribune startribune.