“Biblical” Floods Grip Eastern Colorado (why storm speed is as critical as storm intensity)

Biblical
In 40 years tracking the vagaries & eccentricities of the weather I’ve never seen the National Weather Service refer to a flood as “biblical”. That’s how the Denver office described it late last week. 15 inches of rain, falling on drought-hardened, wildfire-scarred soil, which made run-off even worse.
It wasn’t the result of stalled T-storms, but a much-larger scale storm marooned over the Intermountain West, stuck in place for 6 days, forcing tropical moisture up against the Front Range. When assessing the potential for disaster don’t just look at the intensity of a storm. The forward speed is just as critical.
When weather systems stall bad things often result: more intense heat, drought or flooding.
The 1991 Halloween Superstorm that dumped over 30 inches of snow on MSP will be forever tattooed on my psyche. That storm stalled too, and the models didn’t pick it up.
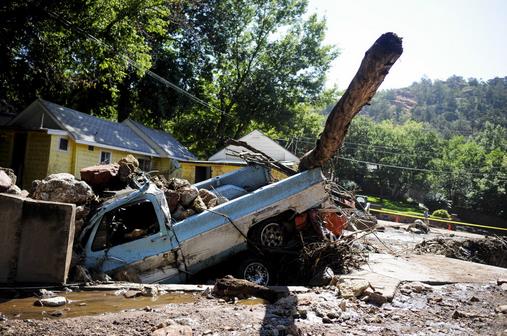
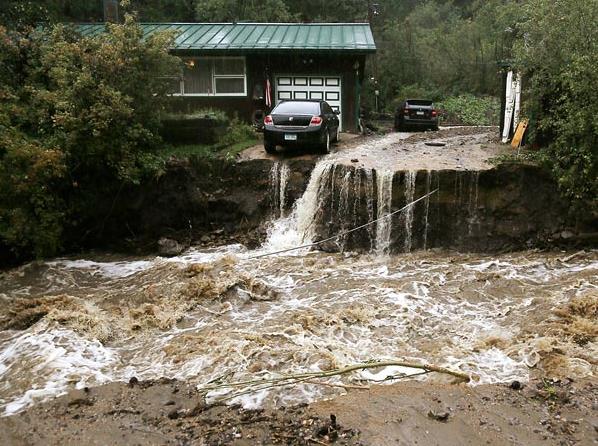
Photo credit above: “A truck and car is washed away by a flash flood that hit Manitou Springs, Colo., Friday sits in a drainage, covered in rocks, Saturday, Aug. 10, 2013. Friday’s torrential rains swept mud, boulders and other debris from the burn scar down U.S. 24, washing away vehicles and damaging several homes and businesses in the area.” (AP Photo/The Colorado Springs Gazette, Michael Ciaglo).
Colorado Flood Death Toll Rises; 500 Still Unaccounted For. Christian Post has more details on the incredible flooding underway; here’s a clip: “…In Boulder, which bore the brunt of the disaster, the number of rescuers was doubled to around 800 on Saturday. Airlifts will continue Sunday in Boulder, Larimer and Weld counties, authorities said. When Gov. John Hickenlooper toured flooded areas in a helicopter on Saturday, he had to halt twice to rescue six stranded people and their two pets. Up to 4 inches of rain could fall by Sunday afternoon, Boulder officials said, and advised all in affected areas to evacuate. “We’re not trying to force anyone from their home,” Boulder County Sheriff Joe Pelle said. “We’re not trying to be forceful, but we’re trying to be very factual and definitive about the consequences of their decision, and we hope that they will come down…”
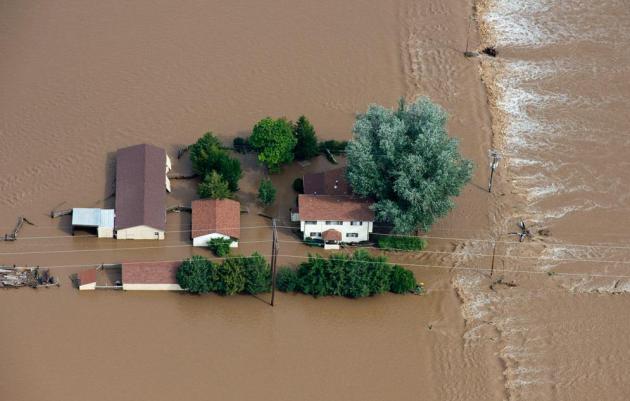
Photo credit above: “Reuters/John Wark. “An aerial view of a farm house surrounded by flood waters along the South Platte River near Greenley, Colorado September 14, 2013. Farming communities along the South Platte River were ordered to evacuate ahead of a predicted surge in the flooding which may have claimed a fifth life and has left many still unaccounted for, according to authorities.”
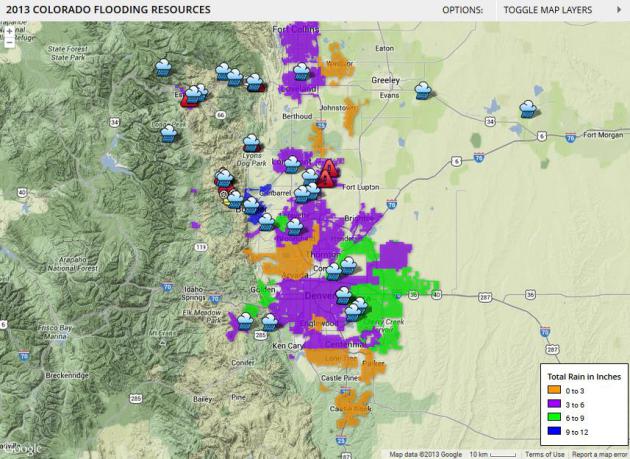
2013 Colorado Flood Resources Map. The Denver Post has a terrific, interactive map that shows the scale of resources focused on helping flood survivors: “This map displays layers for emergency flood shelters, rain totals for Colorado towns, and news stories by location. Use the menu in the upper right corner to toggle layers on and off. Rain totals are from either the National Weather Service or the Community Collaborative Rain, Hail & Snow Network. If multiple measurement were reported for different areas of a city, the highest was used.“
* “Flash Flood Products: What Do They Mean?” Here’s a good recap and reminder from NOAA.
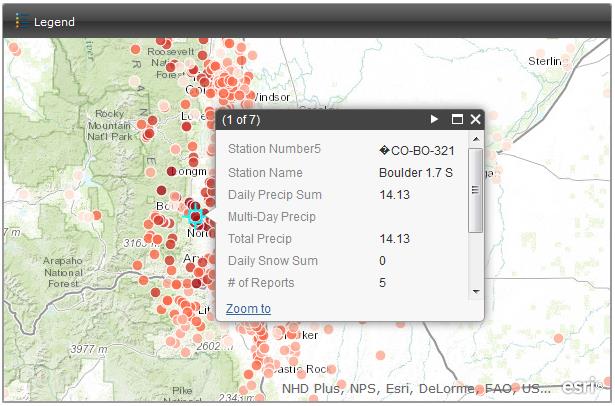
A Year’s Worth Of Rain In 3-4 Days. Check out this interactive CoCoRaHS high-resolution rainfall map showing accumulated totals for this (historic) event, courtesy ofbrendansweather.com.
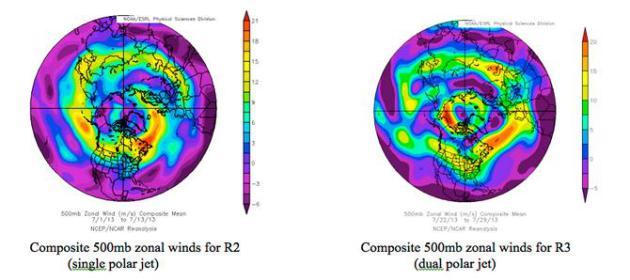 Summer 2013 Weather Extremes Tied To Extraordinarily Unusual Polar Jet Stream. Here’s an excerpt of a good article from Steve Tracton at The Capital Weather Gang that explains the “split” polar jet, a shift in the pattern that may be at least partially responsible for some of the odd weather we’ve witnessed in 2013, including the historic floods near Boulder. Here’s an excerpt: “For at least the past one or two decades the adjective extreme has increasingly become used in describing unusual weather. It’s virtually impossible now to escape news of extreme drought, excessive rainfall and floods, record breaking heat waves, cool spells and severe weather outbreaks, etc. which seem to recur year after year around the Northern Hemisphere. This summer was no different except that the behavior and configuration of the polar jet stream, the river of high altitude winds marking the divide between warm and cool air, were rare and mind-boggling. Instead of meandering as a single stream like it normally does, it transformed into a “dual” jet stream configuration, sometimes transitioning from this dual setup back into a single more coherent stream, back and forth…”
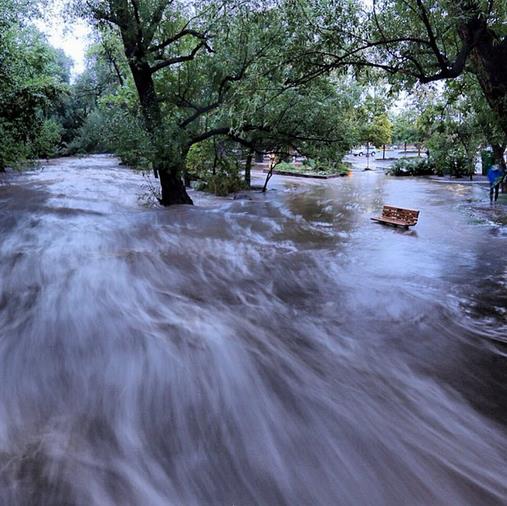
Colorado Floods Created By Hot September, Long Monsoon Season. Here’s a clip from The Denver Post: “…Last week’s rainfall is also likely to make Colorado a laboratory for climate change research. “Scientists can use computer models to see how often similar events occur, both with and without the presence of greenhouse gases produced by human activity,” wrote Bob Henson, a science writer at the University Corporation for Atmospheric Research in Boulder. “It’s then possible to estimate how much the odds of such an event have been boosted by fossil fuel use.” In 24 hours, Boulder was deluged with half the precipitation it sees in an average year. From Monday to Friday, more rain fell on the city than the entire year before the storm.“
Photo credit above: “In this image made with a slow shutter speed which blurred the rushing water, flood waters course through a small park in Boulder, Colo., Thursday morning, Sept. 12, 2013. Heavy rains and scarring from recent wildfires sent walls of water crashing down mountainsides in the area.” (AP Photo/Jud Valeski).
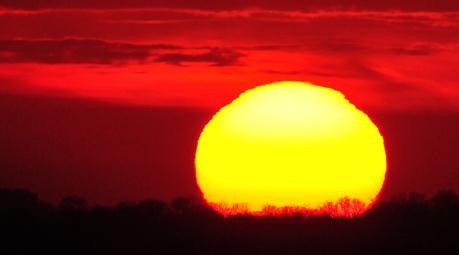
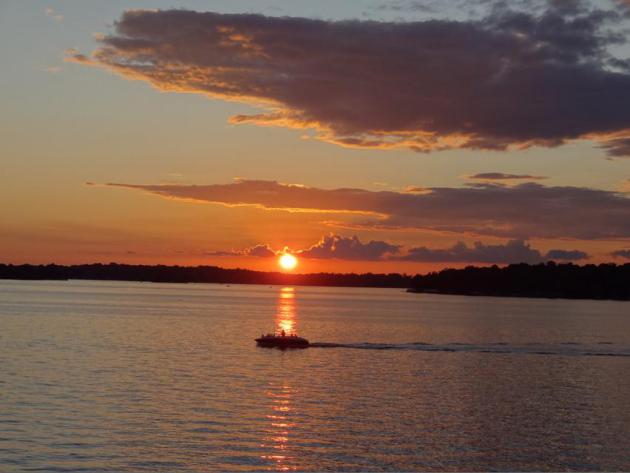
An Unusually Sticky End of Summer. Here’s a clip from Dr. Mark Seeley’s weeklyWeatherTalk segment, focused on the number of 70-degree dew point days at the end of summer: “…So far, and this is likely to be close to the final number, MSP has reported 246 hours in 2013 with a dewpoint of 70 degrees F or higher. This is well above the historical average and over the past 68 years (since 1945) ranks as the 15th highest annual value (the highest being 512 hours in 2002). What is unusual about this year is that the majority of hours with such high dewpoints (including a record setting value of 77 degrees F on August 27th) occurred later in the year (late August and early September), and not in late June to early August as normally happens…”
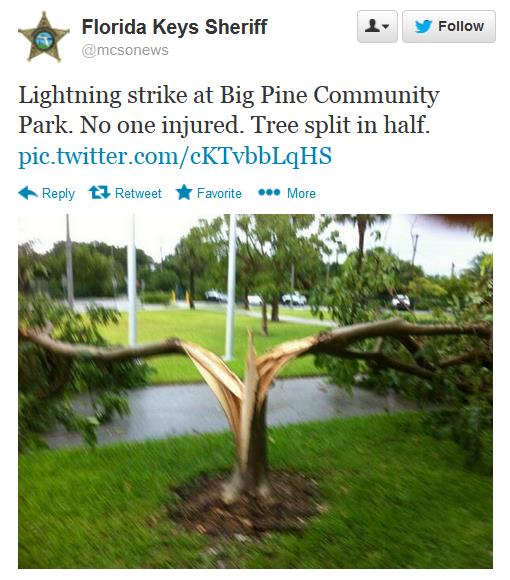
The Power of Lightning. Thanks to the Florida Keys Sheriff and Twitter for sharing the aftermath of a cloud to ground strike over the Keys. Ouch.
Climate Stories…
Colorado’s “Biblical” Flood In Line With Climate Trends. No, it’s not your imagination – we are seeing more extreme rainfall amounts; 4 1-in-1,000 year floods in Minnesota since 2004, according to the MN Climate Office, including last year’s historic flood in Duluth. Here’s an excerpt from meteorologist Andrew Freedman and Climate Central: “…Extreme rainfall events have become more frequent across the U.S. during the past several decades in part due to manmade global warming. Increasing air and ocean temperatures mean that the air is generally carrying more water vapor than it used to, and this moisture can be tapped by storm systems to yield rain or snow extremes. Trends in extreme precipitation events vary by region, though, and in general the biggest increases have taken place in the Midwest and Northeast. However, most parts of the U.S. have seen an increase in extreme precipitation events, according to the draft National Climate Assessment report that was released this past January. The report goes on to note that in the future, “increases in the frequency and intensity of extreme precipitation events are projected for most U.S. areas…”
Image credit above: “Water vapor satellite loop from Sept. 12, 2013 showing the plume of moisture directed at Colorado.” Credit: CIMSS.

Calling Out The Climate Conspirators. Here’s an excerpt of a story at Columbia Journalism Review that shows how quickly erroneous information and stories can percolate up through the denial-sphere, in this case the U.K. Daily Mail: “…But the problem with the Internet is that it often doesn’t weigh the reliability of sources before spreading their ideas around the masses. Both MSN and the Telegraph regurgitated Rose’s cooling mantra, which then briefly trended on Twitter. Which means that, regardless of the outrageous nature of Rose’s claims, science writers (that is, writers whose work is based in actual science) spent the early part of their week dismantling his piece. First, in The Guardian Dana Nuccitelli issued a dense, point-by-point rebuttal of Rose’s arguments, beginning with his suggestion that this year’s increase in sea ice could be used as evidence of a warming reversal. Sea ice levels are 60-percent higher this year than last—though the measurement should hold until the end of the September melting period—but as Nuccitelli points out, the rate of ice retreat is only significant when contextualized by last year’s dramatic depletion rate..”
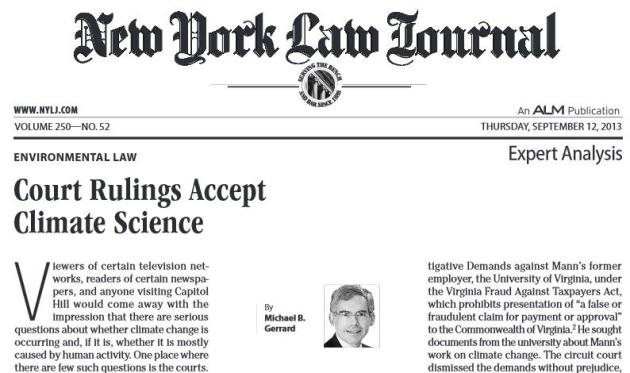
Court Rulings Accept Climate Science. The full PDF article from the New York Law Review is here.
_______________________________________________________________
ABOUT ME
Welcome to the WeatherNation blog. Every day I sift through hundreds of stories, maps, graphics and meteorological web sites, trying to capture some of the most interesting weather nuggets, the stories behind the forecast. I’ll link to stories and share some of the web sites I use. I’m still passionate about the weather, have been ever since Tropical Storm Agnes flooded my home in Lancaster, PA in 1972. I’ve started 5 weather-related companies. “EarthWatch” created the world’s first 3-D weather graphics for TV stations – Steven Spielberg used our software in “Jurassic Park” and “Twister”. My last company, “Digital Cyclone”, personalized weather for cell phones. “My-Cast” was launched in 2001 and is still going strong on iPhone, Android and Blackberry. I sold DCI to Garmin in 2007 so I could focus on my latest venture: WeatherNation. I also write a daily weather column for The Star Tribune startribune.