Colorado Flood: 1 in 1,000 Year Event? (and why you might want to consider an emergency generator)

Christmas Wish
All I want for Christmas is some time away from my laptop, quality time disconnected from The Matrix. That, and an emergency generator would be nice.
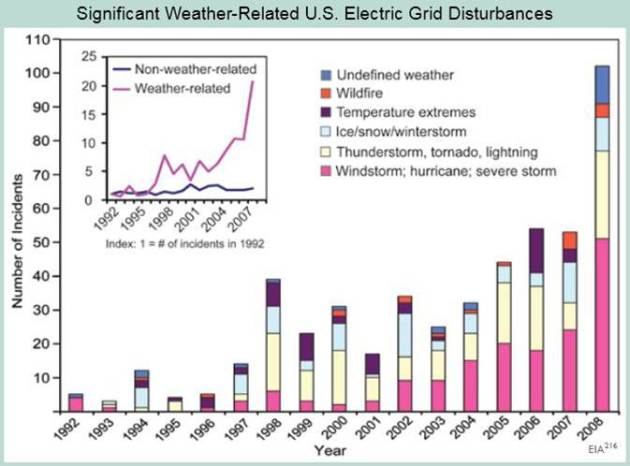
Yesterday I spoke to utility executives at The Midwest Energy Association, where I talked about weather & climate trends. Extreme weather has triggered a 10-fold increase in electric grid incidents since 1992 across the USA. Keeping the lights on has become even more challenging. Take nothing for granted.
That, and an update on the sun, at the peak of the solar cycle. It’s been very quiet as of late, but in any given decade there’s a 12 percent risk of an X-class solar flare capable of bringing down parts of the power grid. Have a nice day!
This is my cue to turn to the sports page.
No weather-gotchas lurking out there anytime soon close to home, although a morning thundershower may jolt you from your stupor. Behind this warm front highs top 80F by late afternoon. A September summer serenade. Soak it up because a fresh push of 60s arrive via Canadian Air Mail Friday & Saturday; weekend lows dipping into the 40s.
Fresh air – low humidity – fewer bugs. Now if we can just get a 2-3 day soaking rainstorm to replenish soil moisture we’ll be in great shape!
* graph above courtesy of The Energy Information Administration, U.S Global Change Research Program.
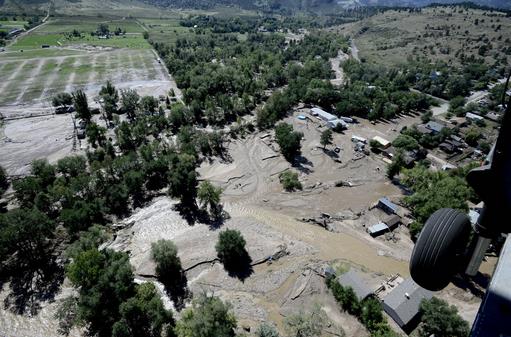
Photo credit above: “This aerial photo shows part of Lyons, Colo. which was hard hit by flooding in recent days, Tuesday, Sept. 17, 2013, as seen from a rescue helicopter flown by the 2-4 GSAB 4th Infantry Division based in Ft. Carson. The emergency airlifts of flood victims waned Tuesday, leaving rescue crews to systematically search the nooks and crannies of the northern Colorado foothills and transportation officials to gauge what it will take to rebuild the wasted landscape.” (AP Photo/The Daily Camera, Mark Leffingwell, Pool)
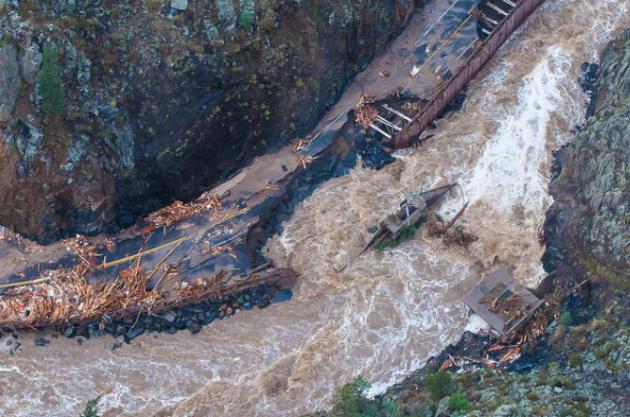
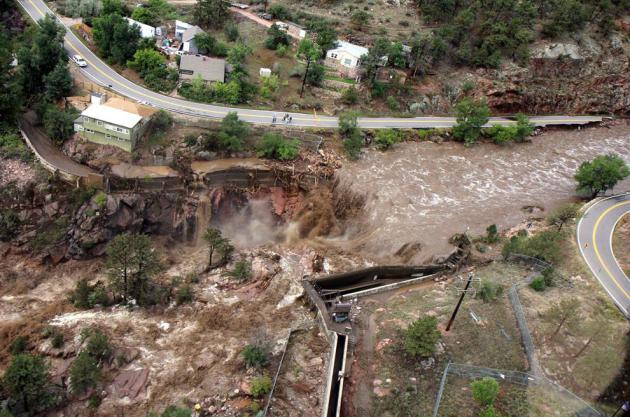
Photo credit above: “Shown is structural damage through Northern Colorado: Boulder, Longmont, Estes Park, Lyons, and Hwy 34 along the Big Thompson River.” (Colorado National Guard).
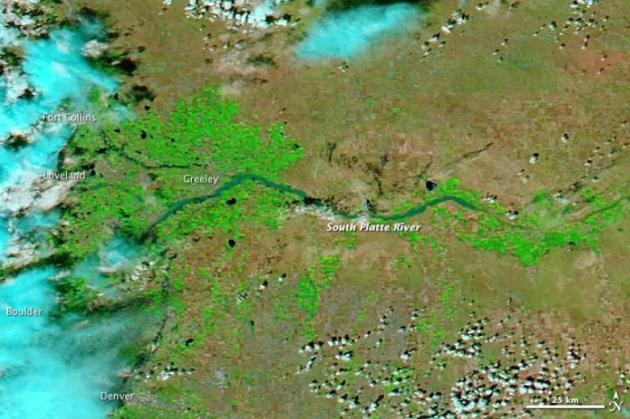
Colorado Flooding From Space. Here is one of several remarkable images of flooding still underway along Colorado’s Front Range, courtesy of NASA’s Earth Observatory: “Intense rainfall in northern and eastern Colorado brought widespread, destructive flooding in mid-September 2013. Local citizens reported as much as 18 inches (46 centimeters) of rain from September 9 to 15, with some of the heaviest accumulation along the front range of the Rocky Mountains. A break in the precipitation allowed the Moderate Resolution Imaging Spectroradiometer (MODIS) on NASA’s Aqua satellite to acquire the top image of the floods on September 14. The lower image, taken by Terra MODIS on September 7, 2013, shows the region before the rains began. The images were made from infrared light to increase the contrast between water and land. Water is typically black or dark blue in these images, but here the sediment-laden water and muddy ground are light blue. (In the true-color version, the muddy river blends with the brown landscape that surrounds it.) Irrigated farmland is bright green, while natural vegetation and bare ground are pale green and tan, respectively. Bright blue and white clouds still cover cities along the front of the Rocky Mountains, including Denver, Boulder, Loveland, and Fort Collins…”
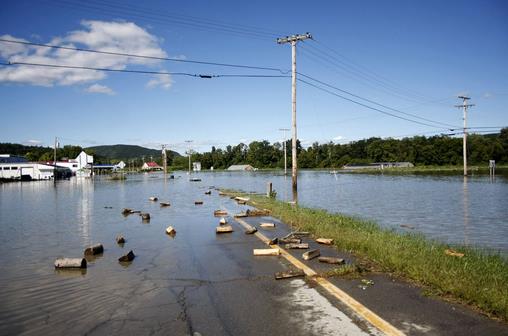
1,000 Year Flood Hits Colorado Hard. Here’s a clip from a story at Mission Network News: “Colorado’s deluge is being classified as a 1,000-year event (meaning there’s a 0.1% chance that a similar flood could happen in a given year). The rainfall has simply been astonishing–upwards of 12 inches in less than 24 hours in some locations near Boulder. Devastating flooding resulted in some areas, and in others, the disaster approached historical proportions of 200 times the normal precipitation amounts. Essentially, the weather experts say that two circular weather patterns converged just long enough to draw in moisture from the coast of Mexico and the leftovers of tropical cyclone Lorena. As the moisture pushed up against the Front Range, it had trouble getting over it so it dumped right where it was…”
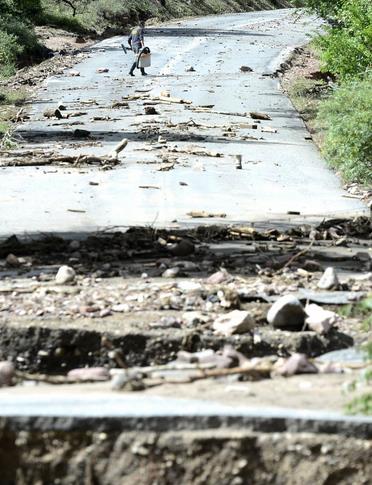
Photo credit above: “A man walks down Wagonwheel Gap Road in Boulder, Colo., on Monday Sept. 16, 2013. Officials hope the number of missing will drop rapidly as communications are restored and people are evacuated throughout the region, as it did in Larimer County, where almost 250 people were lopped off a missing-persons list over the weekend, and Boulder County, where the list shrunk by 187 people.” (AP Photo/The Daily Camera, Mark Leffingwell)
* In Longmont, Colorado they’re already calling this a 1 in 500 year flood.
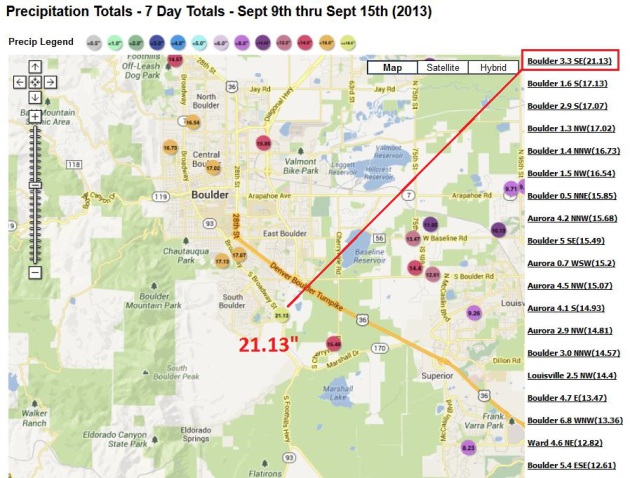
1,000 Year Rainfall? Map above, courtesy of NOAA, shows 21.13″ of rain in the last 7 days in falling on South Boulder.
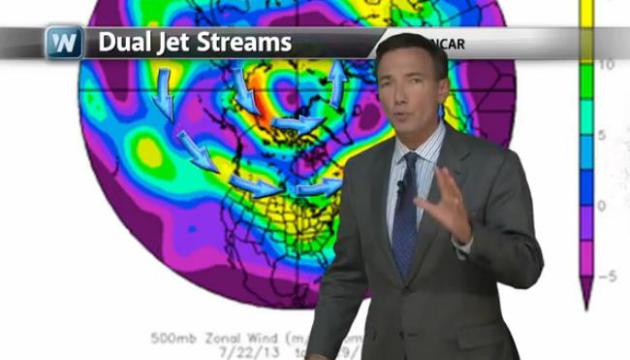
Historic Flooding Continues To Ravage Colorado. It was the Perfect Storm for the Front Range. Stalled synoptic-scale storm near Salt Lake City, turning on an extended 5-6 day “fetch” of tropical moisture originating from the eastern Pacific with record precipitable water values – combined with a stubborn upslope flow that created wave after wave of heavy rain. “Atmospheric Rivers” are thought to pose the greatest risk to California, but there’s no reason why a river of excessive moisture can’t set up from southwest to northeast, as it did late last week. Today’s Climate Matters segment looks at the Colorado Flood; natural weather enhanced by strange twists and turns in the jet stream (and more water vapor) that may be a direct result of a slowly warming climate.
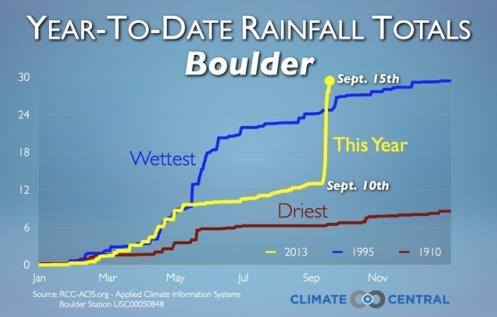
Flood-Ravaged Boulder, Colorado Sets Annual Rainfall Record. This takes weather whiplash to a whole new extreme. Here’s a clip of Climate Central story from meteorologist Andrew Freedman, with some remarkable rainfall statistics: “…With 30.12 inches of rain and counting, more than half of which fell since Sept. 9, the city has already eclipsed its previous mark of 29.93 inches, set in 1995. Boulder’s average yearly precipitation (rain and melted frozen precipitation) is 20.68 inches. The record is especially noteworthy since before Sept. 9, Boulder, along with much of eastern Colorado, was still mired in long-term drought conditions…”
Graphic credit above: “So much rain fell since Sept. 9 that Boulder, Colo., went from having one of its driest years on record to its wettest.” Credit: Dennis Adams-Smith/Climate Central.
NWS Says Flooding “Historically Significant”. No kidding. Here are more details fromThe Boulder County Business Report: “Is this week’s flooding in Boulder County a 100-year event? Five hundred? One thousand? Jim Keeney, weather program manager for the National Weather Service’s Central Region, said the NWS hasn’t made a determination because flooding is still rampant along Colorado’s Front Range. But he did offer one comparison to lend some perspective on Friday. The Big Thompson River flood of 1976 has long been a sort of benchmark for flooding in the region. That flood crested at 9.31 feet in the town of Drake. The flooding that slammed the foothills and Front Range this year crested at 10.55′ Friday morning…”
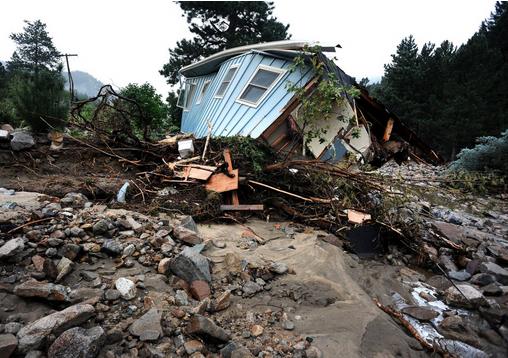
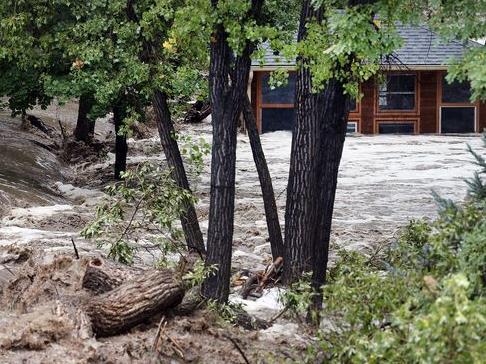
Photo credit above: “A house lays completely demolished in what was the path of the recent floods that have destroyed the town of Jamestown, Colo., on Sunday Sept. 14, 2013. No one has been able to access the town until late Sunday afternoon when crews finalized repairs of the upper portion of the road for emergency traffic only. The town has no infrastructure or running water. Some parts of town amazingly enough have electricity. A dozen or so residents stayed as most of the town was evacuated by helicopters.” (AP Photo/ The Denver Post, Helen H. Richardson)
Better Safe Than Viral? Braving The Storm For A Photo. Increasingly, in our social-media-saturated world, people are taking big risks to get the money shot (or video clip). In light of historic flooding in Colorado here’s an excerpt of a timely story at cincinnati.com: “A picture of yourself in front of a raging waterfall, flooded street or heroic rescue team. It’s an image that could go viral on social media. It also could cost you your life. Emergency officials in Colorado are fed up with the number of people heading straight to dangerous, flooded areas to get a new profile picture or score some retweets. In a time of social sharing, officials fear people will go too far for a risky, potentially viral snapshot. “Don’t risk your life for Facebook or Twitter or Instagram,” says Bronson Hillard, a spokesman for the University of Colorado. ” It could be the last picture you ever take.” Hillard says students were flocking to Boulder Creek – the waterway most at risk for flooding – to take photos of one another with water cascading around them…”
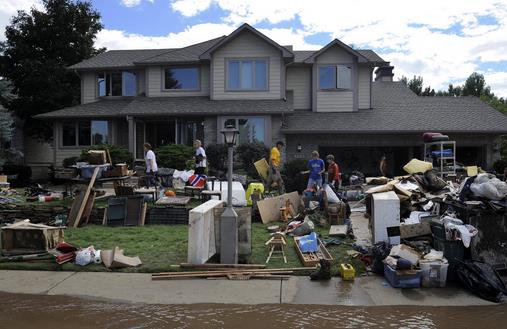
Photo credit above: “Water rushes past a flooded home near Left Hand Canyon.” / Brennan Linsley, AP.
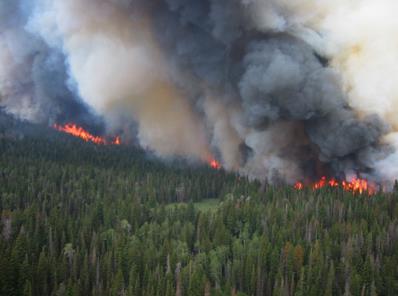
Study: Past Wildfire Speeds Snowmelt. Here’s a post from AP and seattlepi.com: “A new study shows charred forests left behind by wildfires make the mountain snowpack that Western rivers depend on melt faster. Lead author Kelly Gleason, a doctoral candidate at Oregon State University, says they found more snow fell in burned forests than in green ones. But the snow melted off twice as fast in burned forests, and was gone 23 days earlier. The reason was the black bits sloughing off the charred trees onto the snow intensified the heat from the sun...” (Photo: EPA).
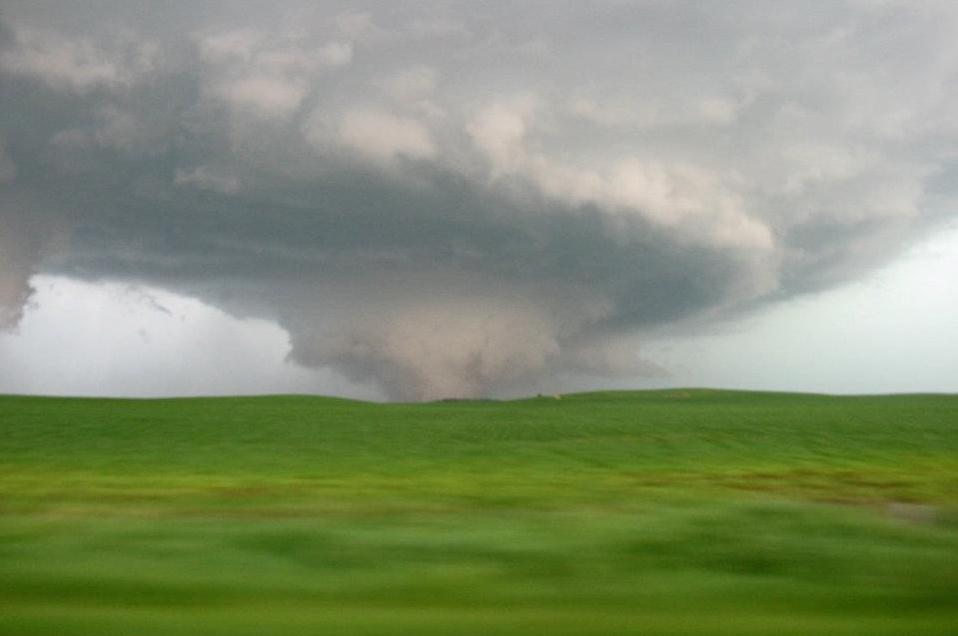
The True Story Of The Yarnell Fire. This is an amazing, and horrifying story – here’s the intro from Outside Magazine: “On the morning of June 30, all 20 members of Prescott, Arizona’s Granite Mountain Hotshots headed into the mountains to protect the small town of Yarnell from an advancing blaze. Later that day, every man but one was dead. Through interviews with family, colleagues, and the lone survivor, a former hotshot pieces together their final hours—and the fatal choices that will haunt firefighting forever...”
Photo credit above: “The lone survivor: Brendan “Donut” McDonough.” More photos from Yarnell. Photo: Dan Winters.


4th warmest. Combined land-sea global temperatures in August tied 2005 for the 4th warmest since 1880, according to NOAA NCDC.
Climate Stories…
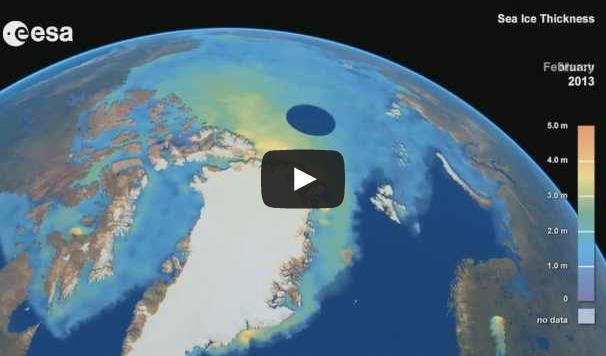
Climate Change: Arctic Ice Volume Shows Consistent Decline. All those rumors of a “recovery” in Arctic ice may be just that – the size of the ice cap has grown from last September’s record low, but ice thickness/volume is another story. Here’s a video clip and excerpt of a story at allvoices.com: “The latest observations on Arctic sea ice from the European Space Agency’s (ESA) Cryosat mission, presented at a symposium in Edinburgh, Scotland, last week, reveal a new record low volume of sea ice in the northern polar region. It may be too early to draw conclusions from the Cryosat data since this ESA mission to monitor variations in the thickness as well as the extent of polar ice has only been returning data since winter 2010-2011 in the northern hemisphere but the latest measurements on Arctic sea ice volumes reinforce historical data on Arctic sea ice melt from the American Meteorological Society, who last month published their climatic report card for 2012, “State of the Climate in 2012.” From Cryosat’s most recent data, it could be a case of ‘never mind the width, feel the quality’ when it comes to Arctic sea ice. Over the past two decades or so, satellite data has confirmed a consistent downward trend in the extent of Arctic sea ice but Cryosat returns accurate information on the mass or volume of ice being lost, allowing scientists to obtain a more complete picture of the changes taking place…”
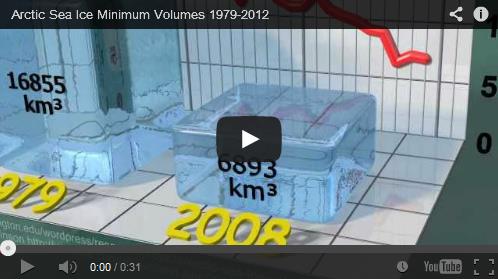
5 Reasons Why Sea Ice Decline Should Be Front Page News. Here’s a clip and video explainer from a story provided by The Union of Concerned Scientists: “In the next few days the Arctic sea ice will reach its minimum extent for 2013. At the end of this year’s summer melt season, the areal extent covered by sea ice was more than a million square kilometers below the 30-year average. That’s a lot of ice missing compared to an average year. An area of frozen ocean—ten times the size of Indiana, or four times the size of Colorado, or a third bigger than Texas—is just not there this summer. While this is shocking and part of a several-decade decline in Arctic sea ice, what’s also alarming is the lack of substantive media coverage. The decline in Arctic sea ice should concern all of us in the same way that a collapse of the economic system does. It deserves front page billing. A recent Nature commentary stated that “the costs of a melting Arctic will be huge, because the region is pivotal to the functioning of Earth systems such as oceans and the climate.” They don’t mince their words…”

Europe’s Hottest Days Are Even Hotter Because Of Climate Change. We’re seeing more 2-Sigma and 3-Sigma heat waves, 2 to 3 times the standard deviation from “average”. Whatever average is these days. Here’s a clip from redorbit.com: “Whileclimate change has caused temperatures to spike throughout much of the world, a stretch of Europe from southern England and northern France to Denmark has been especially affected, according to new research published Wednesday in the journal Environmental Research Letters. Researchers, from the Grantham Research Institute on Climate Change and the Environment at the London School of Economics and Political Science and the University of Warwick, have found that the hottest five percent of days — as well as the coldest nights — in this region of the continent have warmed more than four times the global average since 1950…”
Photo credit above: Thinkstock.com.
What’s Causing Global Warming? Look For The Fingerprints. Here’s an excerpt of an article at The Guardian: “…What did they find? Certain patterns emerge that are consistent with the “human only” scenario. For instance, the heating of the lower atmosphere and cooling of the upper atmosphere, which satellites clearly see, could only happen if human emissions were the culprit. But the study went further; they actually stacked the deck of cards in favor of nature. They used solar and volcanic variations much larger than those that actually occurred since 1979. The strategy was to see if even a worst case “world without us” could be made to look like the current measurements. But, even that didn’t work. The human influence still stood out. Perhaps the best summary is in the abstract of the paper.
“We show that a human-caused latitude/altitude pattern of atmospheric temperature change can be identified with high statistical confidence in satellite data. Results are robust to current uncertainties in models and observations … Our results provide clear evidence for a discernible human influence on the thermal structure of the atmosphere”.
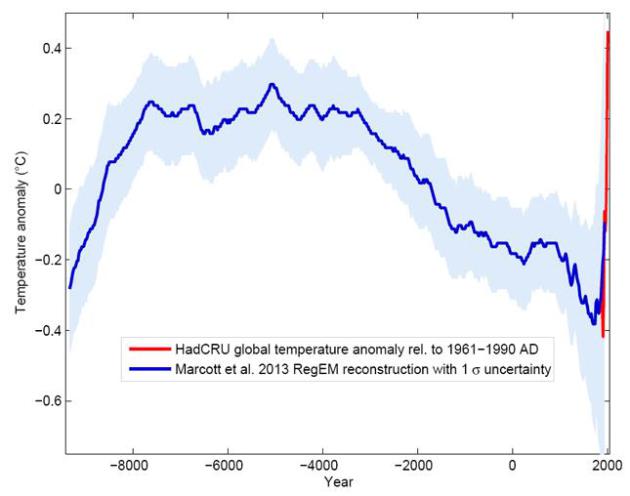
Temperature Chart For The Last 11,000 Years. Here’s an excerpt from a post atkottke.org: “For the first time, researchers have put together all the climate data they have (from ice cores, coral, sediment drilling) into one chart that shows the “global temperature reconstruction for the last 11,000 years” The climate curve looks like a “hump”. At the beginning of the Holocene – after the end of the last Ice Age – global temperature increased, and subsequently it decreased again by 0.7 ° C over the past 5000 years. The well-known transition from the relatively warm Medieval into the “little ice age” turns out to be part of a much longer-term cooling, which ended abruptly with the rapid warming of the 20th Century. Within a hundred years, the cooling of the previous 5000 years was undone…”
ABOUT ME

Welcome to the WeatherNation blog. Every day I sift through hundreds of stories, maps, graphics and meteorological web sites, trying to capture some of the most interesting weather nuggets, the stories behind the forecast. I’ll link to stories and share some of the web sites I use. I’m still passionate about the weather, have been ever since Tropical Storm Agnes flooded my home in Lancaster, PA in 1972. I’ve started 5 weather-related companies. “EarthWatch” created the world’s first 3-D weather graphics for TV stations – Steven Spielberg used our software in “Jurassic Park” and “Twister”. My last company, “Digital Cyclone”, personalized weather for cell phones. “My-Cast” was launched in 2001 and is still going strong on iPhone, Android and Blackberry. I sold DCI to Garmin in 2007 so I could focus on my latest venture: WeatherNation. I also write a daily weather column for The Star Tribune startribune.